Project Viewer
The Project Viewer provides a comprehensive, interactive interface for monitoring active workloads, inspecting rendered frames, and reviewing diagnostic logs in real time.
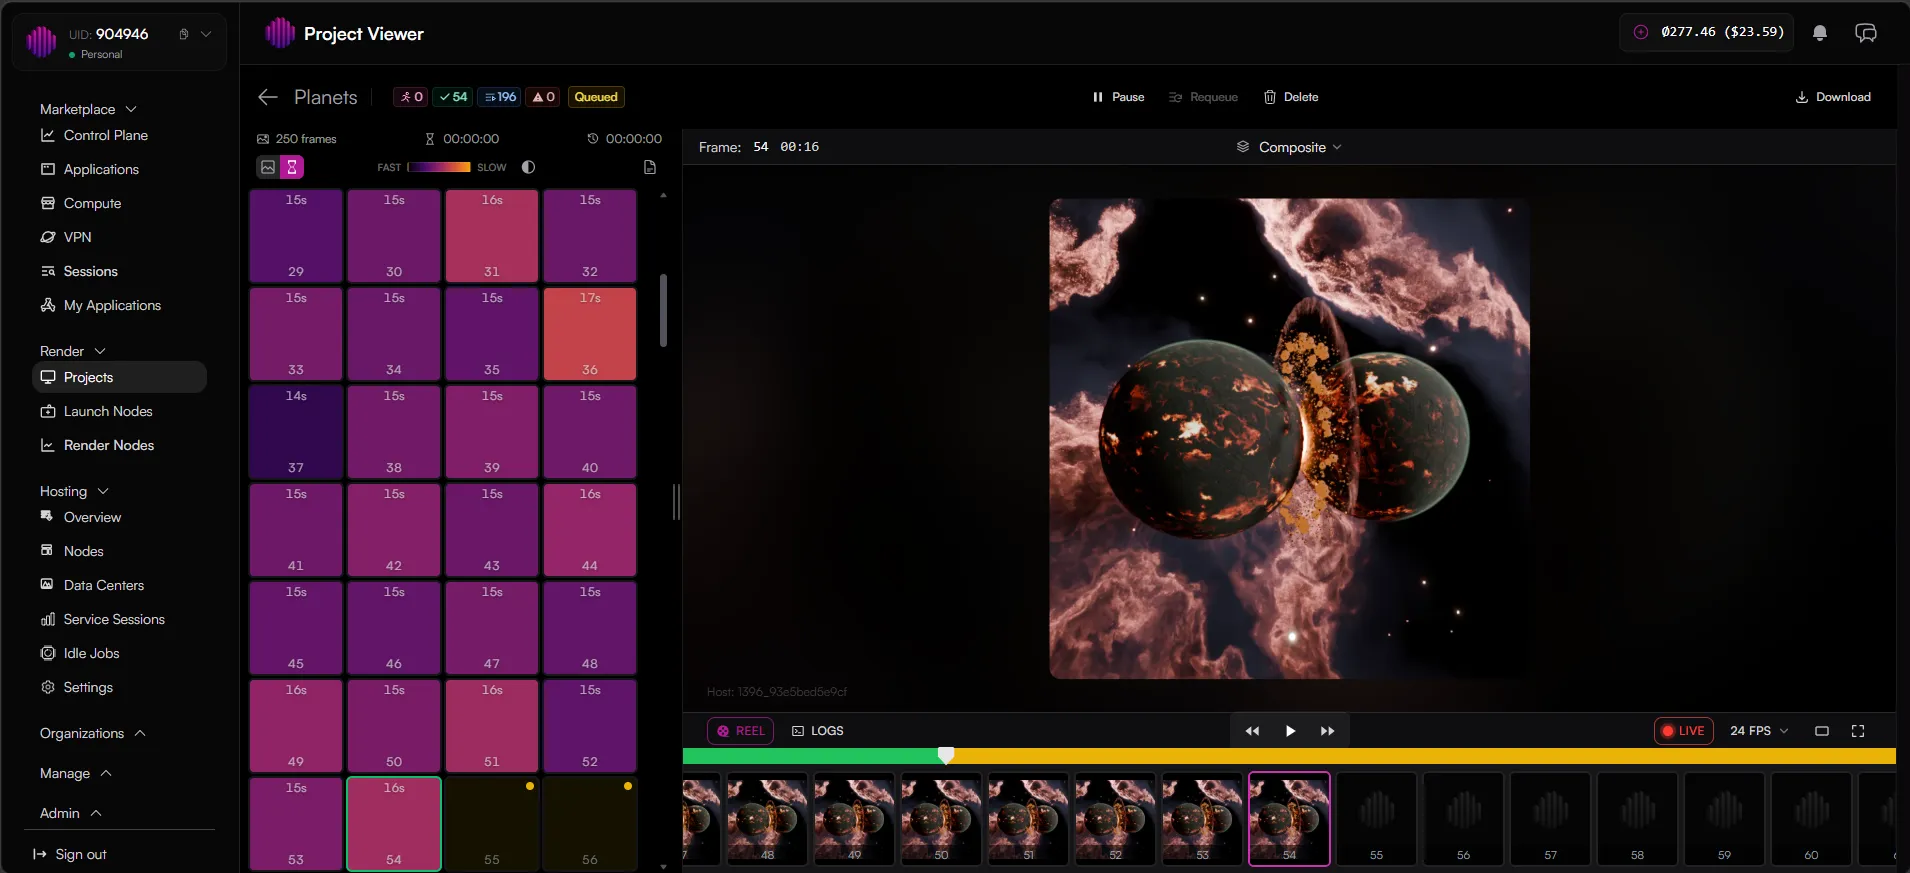
Top Control Bar

Located at the top of the interface next to the project name, this bar provides global metrics and control actions for the current job:
- Status Indicators: Displays a granular breakdown of your frames by status:

- Running: Red icon for frames currently queued on remote nodes.
- Finished: Green check icon indicating successfully rendered frames.
- Queued: Blue badge displaying frames waiting in the queue.
- Error: Red warning icon indicating frames that failed to render.
- Global Actions:
- Pause: Temporarily halts active rendering nodes on the current job.
- Requeue: Re-submits selected or failed frames back into the processing queue.
- Delete: Permanently removes the project and its assets from the platform storage.
- Download: Opens the download menu to retrieve completed sequences.
Time Tracking Metrics
Directly below the project's global action buttons, the interface displays real-time timeline analytics to help you monitor job duration and track completion targets:

- Total Frame Count: Located on the far left, this displays the total number of frames included in the submitted render job.
- Total Render Time Elapsed: Indicated by an hourglass icon, this counter displays the cumulative time that has passed since the project execution started (HH:MM:SS).
- Estimated Time Remaining: Indicated by a clock-with-arrow icon, this dynamically updates to show the projected time remaining before all pending and queued frames are fully processed by the network. (Note: For completed or paused jobs, this value will display as 00:00:00.)
Workspace Layout
The screen is divided into two primary sections: the Frame Sidebar on the left and the Interactive Media Player on the right.
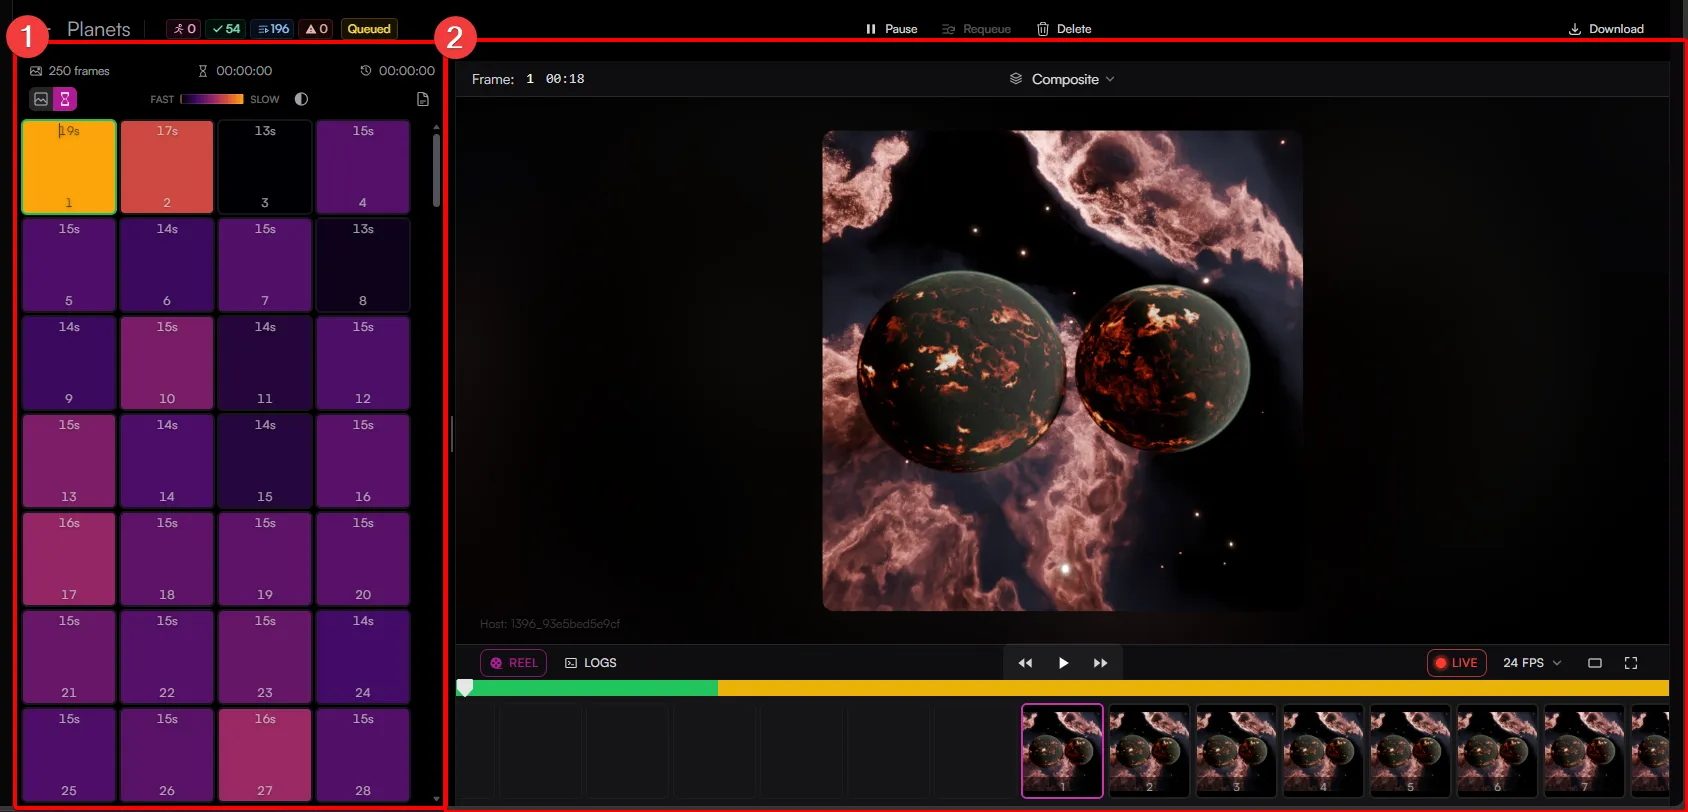
1. Frame Sidebar & Toggle Modes
The left sidebar tracks every individual frame in your project sequence (e.g., a total of 250 frames). You can switch between two distinct visualization modes using the toggle buttons at the top of the sidebar:
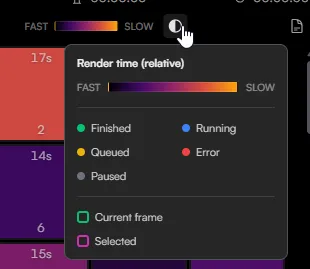
- Grid View (Render Time Heatmap): Default mode, this mode represents each frame as a solid block displaying its exact render duration in seconds (e.g., 19s, 15s). It utilizes a colored heatmap gradient ranging from FAST (purple/dark) to SLOW (orange/light), giving you instant visual feedback on scene complexity across your timeline. Hovering over the half-moon icon opens the legend defining relative render speeds and status color codes.
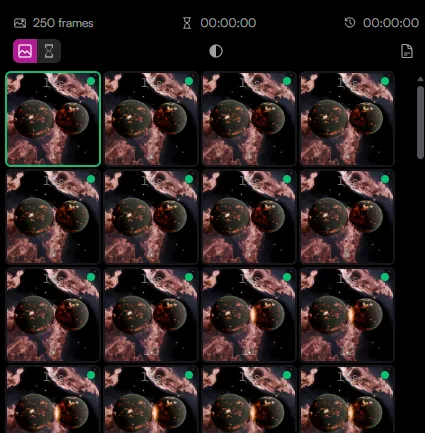
- Thumbnail View: Toggling this option replaces the grid blocks with micro-previews of each individual rendered frame. A small colored dot in the upper-right corner of each thumbnail indicates its current status (e.g., a green dot for completed).
2. Interactive Media Player & Reel View
The right side of the interface acts as a high-fidelity playback viewer and engine diagnostic panel.
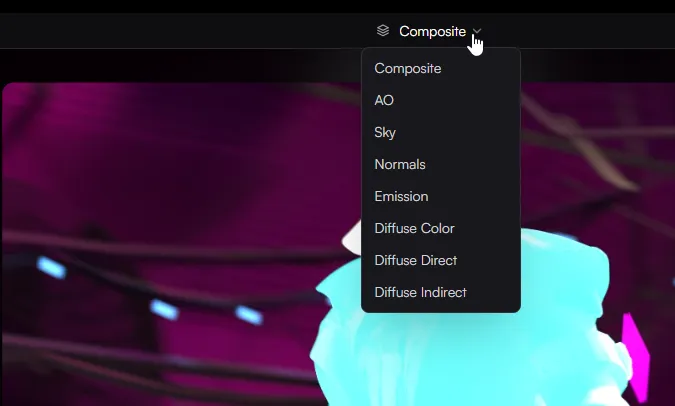
- View Layer / Composite Selector: Located at the top of the viewport area, this dropdown menu allows you to switch between different render layers and passes packed inside your multi-layer EXR file. You can isolate and inspect the Composite maps straight from the browser.
- Reel Tab: Displays a timeline and sequential preview filmstrip below the viewport. It features traditional playback controls (Play, Pause, Fast-Forward, Rewind), a LIVE progress toggle, a workspace orientation toggle, and a fullscreen viewer option.

- FPS Playback Dropdown: You can adjust the preview frame rate on the fly using the FPS selector menu, supporting playback rates of 15 FPS, 24 FPS, 30 FPS, or 60 FPS.
- Logs Tab: Located directly next to the Reel tab under the viewport, clicking LOGS switches the media timeline into a raw stream. This grants you live diagnostic access to look for errors or monitor node activities as frames process.
Frame & Job Info Panel
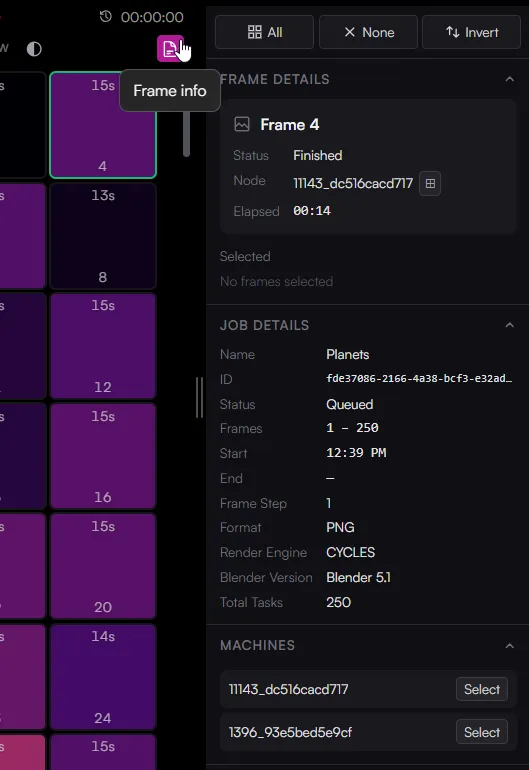
Clicking the Frame info document icon above the frame sidebar expands a detailed metadata panel on the right side of the workspace. This panel provides granular telemetry for individual frames, global job properties, and machine configurations.
Selection Controls
At the top of the panel, quick-action buttons allow you to manipulate your timeline selection on the fly:
- All: Selects every frame in the project sequence.
- None: Deselects all currently highlighted frames.
- Invert: Flips your active selection to all unselected frames.
Panel Breakdowns
1. Frame Details
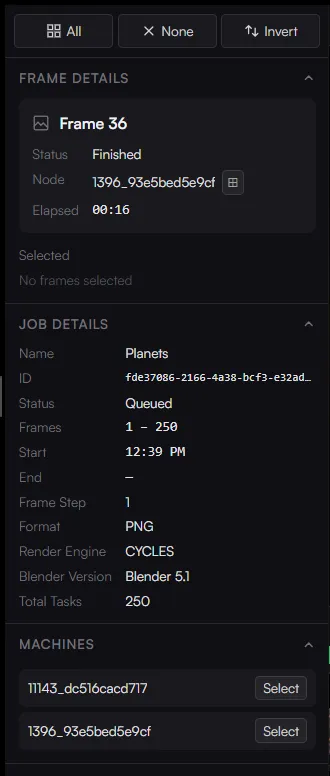
Displays isolated processing metrics for the specific frame currently highlighted in your sidebar grid:
- Status: The current operational state of the frame (e.g., Finished, Error, Queued etc).
- Node: The unique ID of the specific decentralized node that processed or is processing the frame. Clicking the small grid icon next to the ID selects all frames rendered by this node.
- Elapsed: The exact time duration (MM:SS) spent rendering this single frame.
2. Job Details
An immutable summary of the overall project parameters populated during the Blender add-on submission:
- Name & ID: The designated project name and its unique network tracking hash string.
- Status: The macro status of the entire job file across the network queue.
- Frames & Frame Step: The total range span (e.g., 1 - 250) and sequential stepping pattern chosen for processing.
- Start & End: Exact timestamps detailing when the job was initialized and finalized on the farm.
- Format: The file output encoding extension (e.g., PNG).
- Render Engine & Blender Version: The specific technical environment used to process the files (e.g., CYCLES on Blender 5.1).
- Total Tasks: The absolute number of segmented processing tasks generated for the network.
3. Machines & Node Isolation
The Machines section lists the unique host IDs of all decentralized infrastructure nodes processing your workload. Clicking the Select button next to a specific machine activates a powerful troubleshooting and isolation tool:
- Grid Highlighting: The sidebar grid immediately updates to visually highlight all frames handled by that specific node with a distinct pink border.
- Selected Frames Tracker: A new Selected menu dynamically populates right under the Frame Details card, displaying the total number of isolated frames.
- Frame Index List: Below the tracker, a clean, ordered list of specific frame numbers rendered by that node is displayed (e.g., 2, 4, 6, 8, 10...).