Troubleshooting
While OctaRender is an extremely robust platform, each render is unique in its composition and issues may arise. In this section, we will cover how to diagnose these issues and outline your next steps.
Issues most commonly manifest themselves in the form of errored frames. These can be easily identified on the platform, both on the project timeline as well as the frames grid, where they are highlighted with a red indicator tag
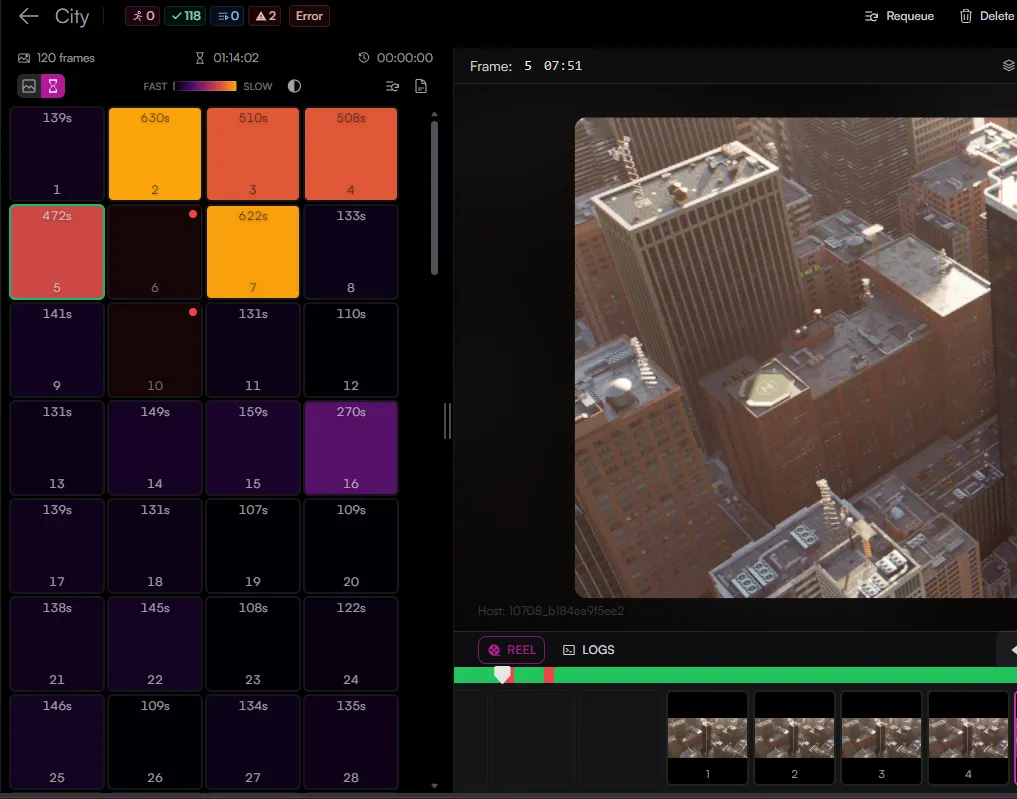
Diagnosing Frame Errors
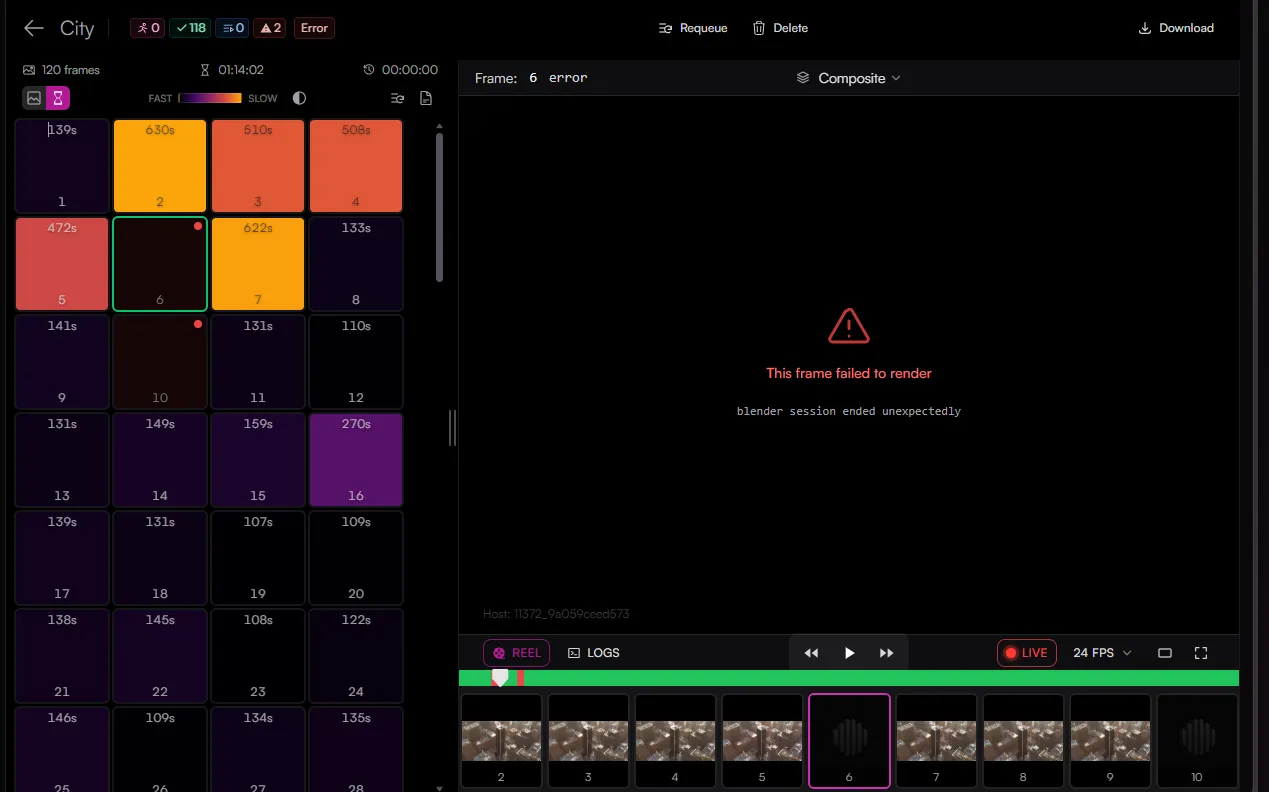
- View Error Summaries: Clicking directly on any errored frame card will update the main viewport to display the high-level error state (e.g., "blender session ended unexpectedly"), helping you instantly see which frame failed and on which specific worker host.
- Inspect Detailed Logs: To diagnose further, click on the LOGS toggle tab directly underneath the main viewer canvas.
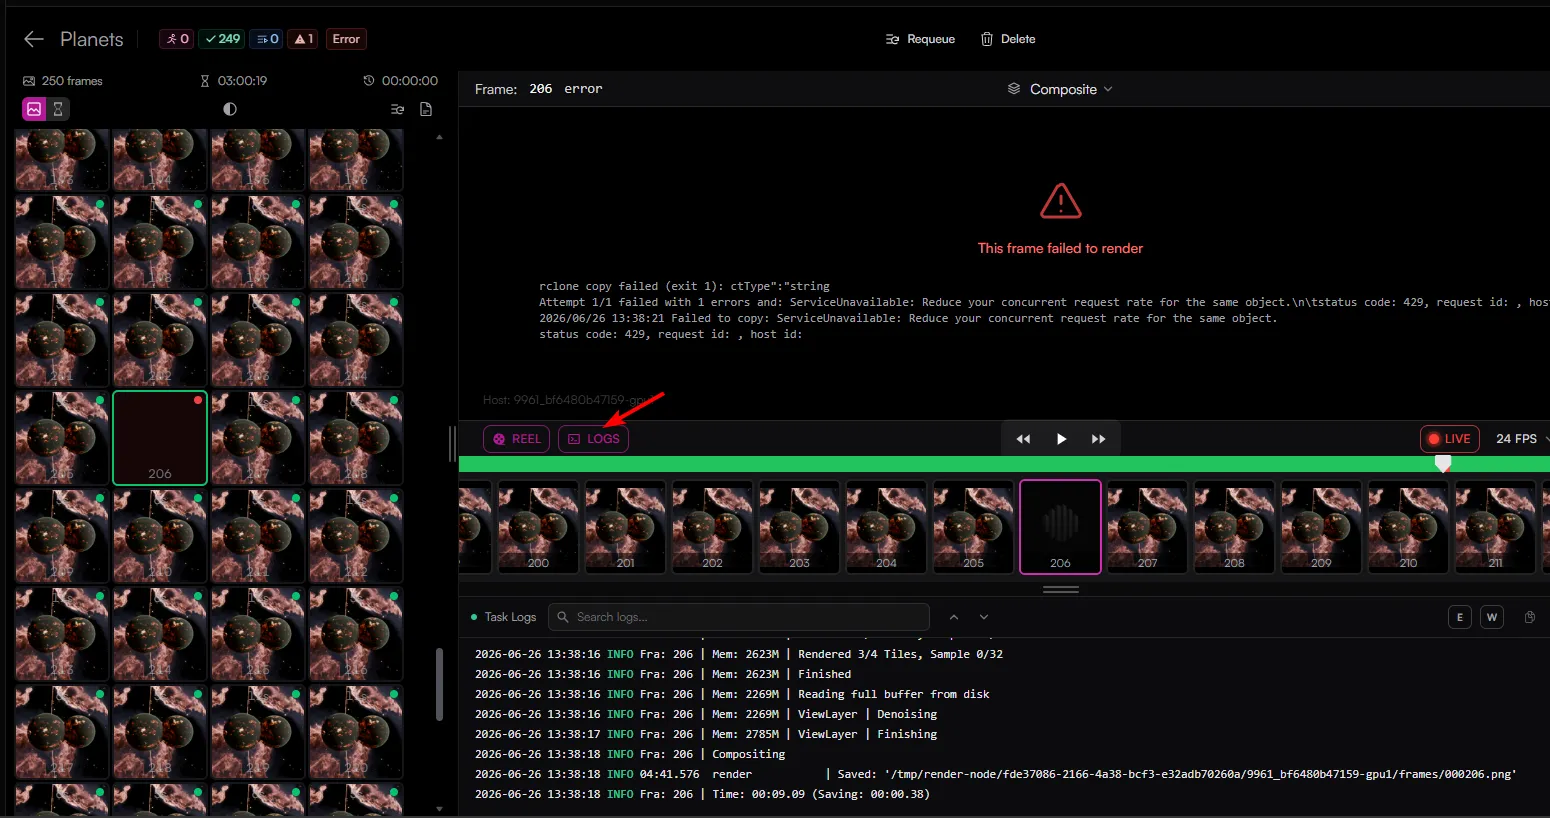
- Analyze Root Causes: This action expands the inline Task Logs terminal layout at the bottom of the dashboard. Here, you can review the actual execution outputs, memory profiles, and stack traces directly from the remote node container to pinpoint exactly what caused the processing disruption.
Common causes
The most common cause of an errored frame is that the hardware node (or nodes) you have rented lacks sufficient system RAM or VRAM to handle the complexity of your Blender scene. Alternatively, an individual provider node may occasionally experience a localized system fault.
If you encounter an error, use the following isolation steps to get your render back on track:
Step 1: Re-queue the Affected Frames
Select the errored frames directly from your grid or timeline and click the global "Requeue" action button at the top of the interface. This pushes the tasks back into the network pool.
Step 2: Identify the Problematic Node
If the frames fail a second time, you will need to pinpoint the exact worker instance causing the bottleneck:
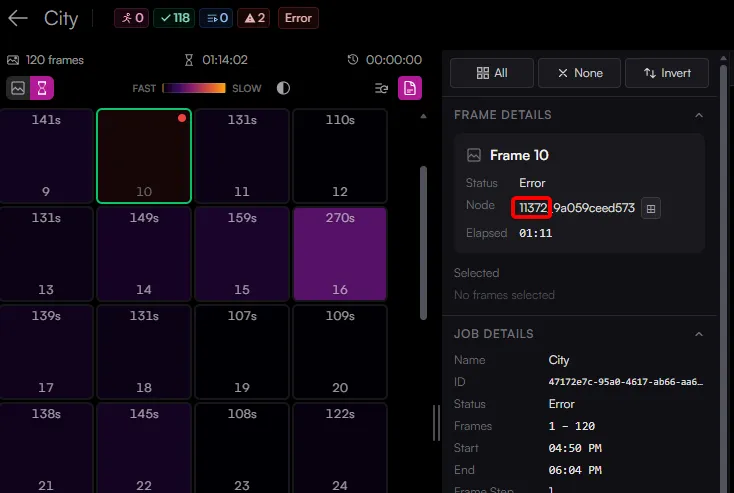
- Click on the specific frame tile that returned an error.
- Click the Frame Info Icon on your toolbar layout to open the sidebar.
- This action reveals the Frame Details panel, which lists the exact Node ID responsible for executing that specific task block.
Step 3: Terminate the Node Session
Once you have copied the faulty Node ID:
- Navigate away from the project view and head to the Render Nodes workspace under Render > Render Nodes.
- Locate the matching machine block using the unique Node ID you identified.
- Click the termination action button on that card to drop the lease and stop your active session with that provider.
Our orchestration system will automatically spin down that unit and redirect your outstanding queue items to healthy, capable hardware slots on the network.
Diagnosing Failed submission
Should you experience an issue while trying to pack or submit your project from the addon, you will need to gather your local environment data before contacting support. Prior to raising a support issue, make sure to capture the direct error logs from inside Blender so our team can diagnose the issue quickly.
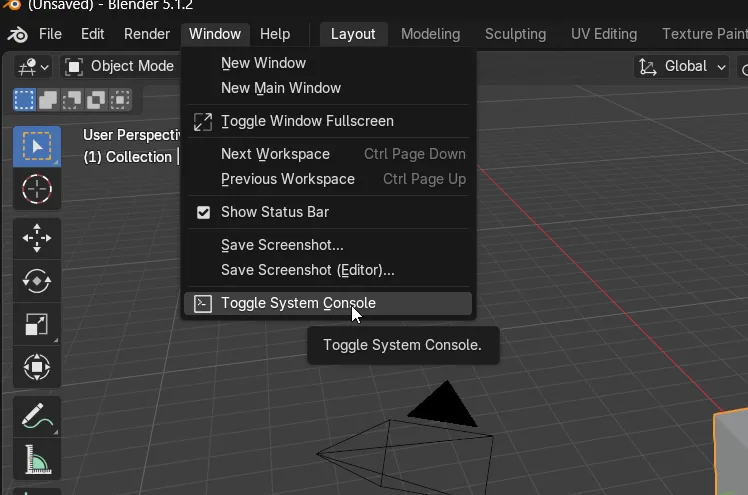
How to Retrieve Blender Console Logs
- In Blender's top menu bar, navigate to Window > Toggle System Console.
- A command-line terminal window will pop open displaying the background processes of the addon.
- Highlight and copy the complete text output leading up to the submission failure.
Still experiencing an issue?
- A brief description of what you were doing when the failure occurred.
- The verbatim terminal output you copied from your Blender System Console and OctaRender logs.
- Your UUID
- Any specific error codes or pop-up warning messages displayed by the addon interface.