Monitoring page
The Render Nodes monitoring page provides a real-time tracking interface for your active and historical decentralized compute allocations. Found under Render > Render Nodes in the Cube portal sidebar, this dashboard gives you complete transparency into telemetry metrics, infrastructure burns, and job statuses.
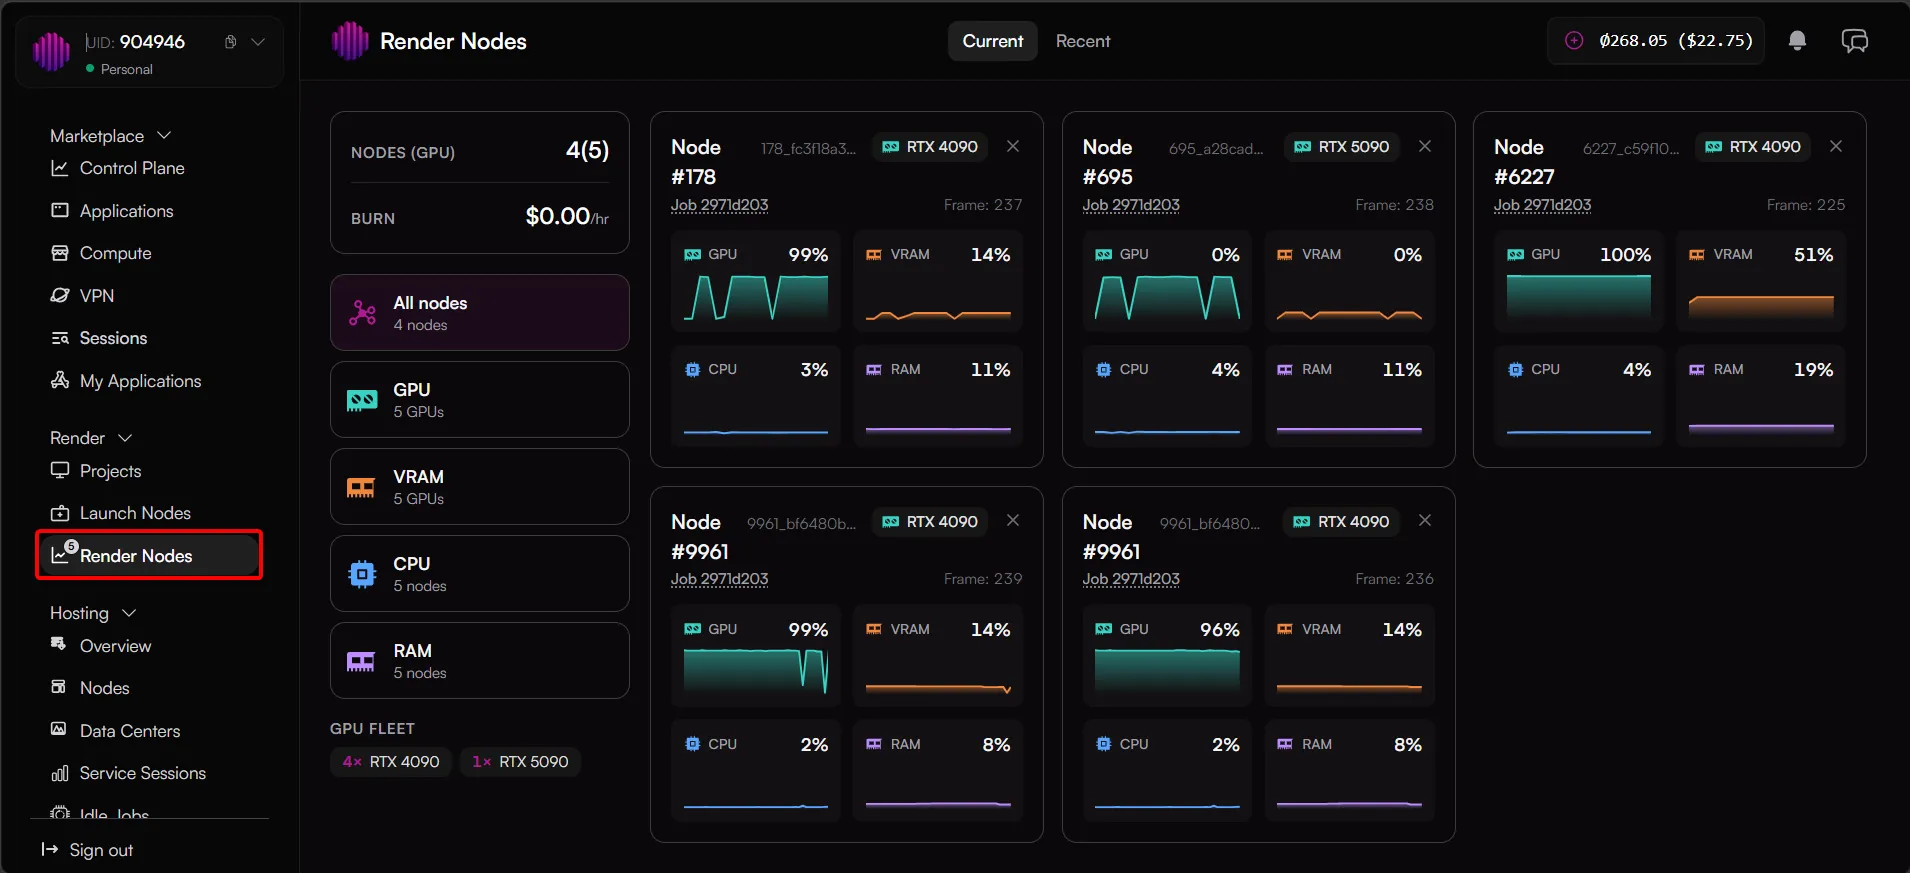
View Toggle: Current vs. Recent
At the top center of the portal layout, you can quickly flip between active deployments and past execution summaries:
- Current View: The real-time operations dashboard detailing telemetry data for all leased nodes currently processing or waiting for rendering jobs.
- Recent View: A comprehensive logging table showing a breakdown of previous render tasks. This history tracker provides detailed data per session, including:
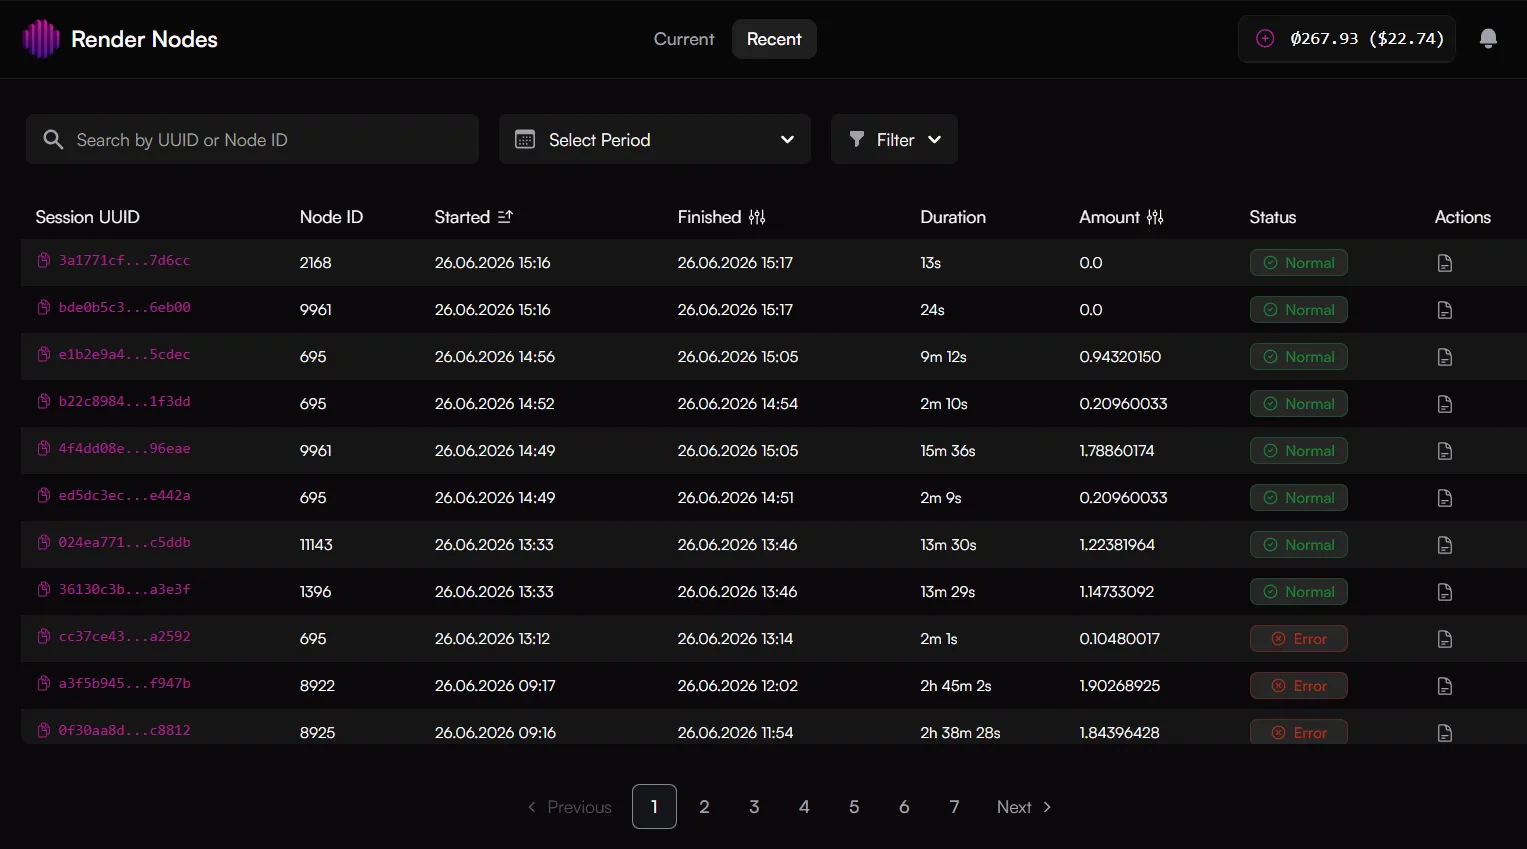
- Session UUID & Node ID: Distinct identifiers for the container environment and the specific hosting provider.
- Timeline Logs: Explicit Started and Finished timestamps alongside a calculated execution Duration.
- Financial & Status Logs: The cumulative accrued Amount charged for the session alongside finalized exit states (Normal vs. Error).
- Actions: Access to granular text-based logs.
Cluster Overview Sidebar
When viewing your active nodes, the sidebar on the left provides an instant high-level diagnostic layout of your leased network slice:
- Nodes (GPU): Displays the count of currently connected worker instances and GPU count (e.g., 4(5) nodes online and 5 GPU's).
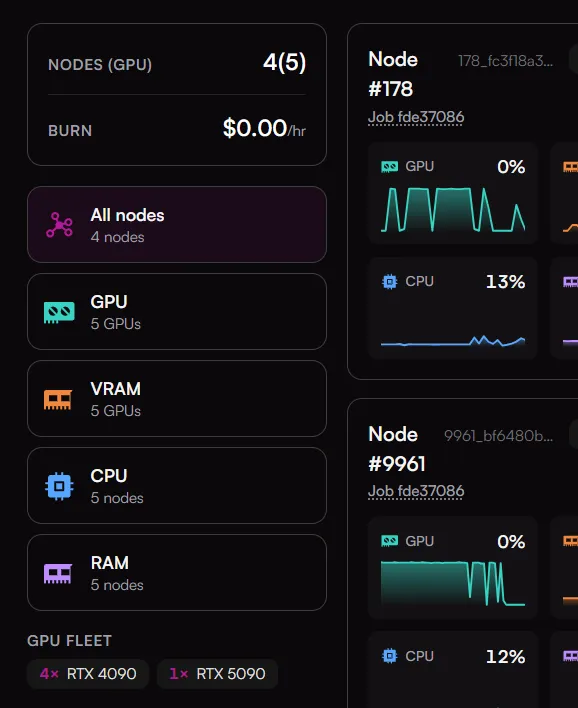
- Burn Rate: Tracks your real-time total operational infrastructure cost per hour.
- Telemetry Category Selection Filters: Clicking these cards alters the main grid view layout to show dedicated real-time micro-charts for specific metrics:
- All Nodes: Restores a comprehensive overview of every machine, showing consolidated compact metric widgets for initialization states and asset ingestion progress.
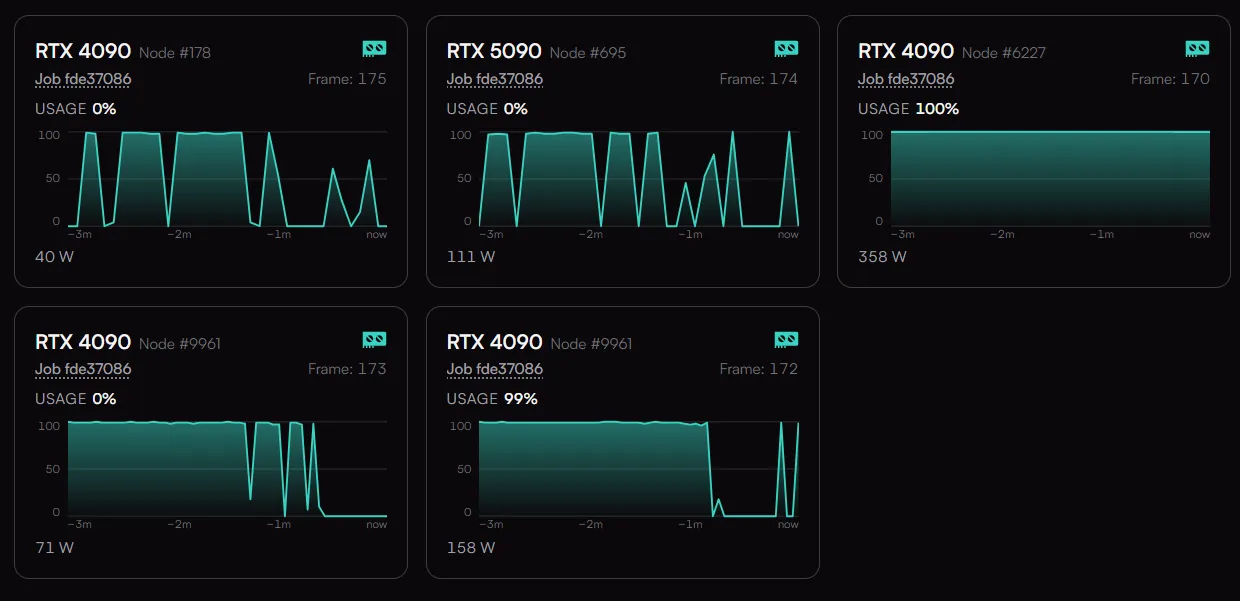
- GPU: Isolates real-time core processing load graphs and current hardware power draws measured in Watts.
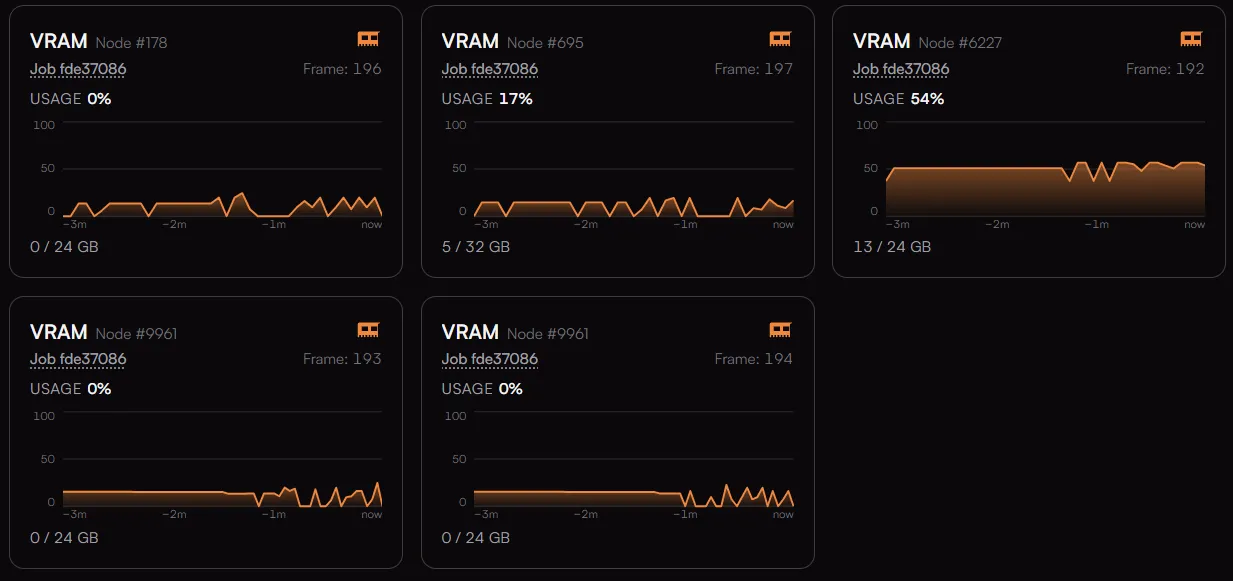
- VRAM: Displays dedicated memory consumption lines showing active buffer loads over host video memory capacity.
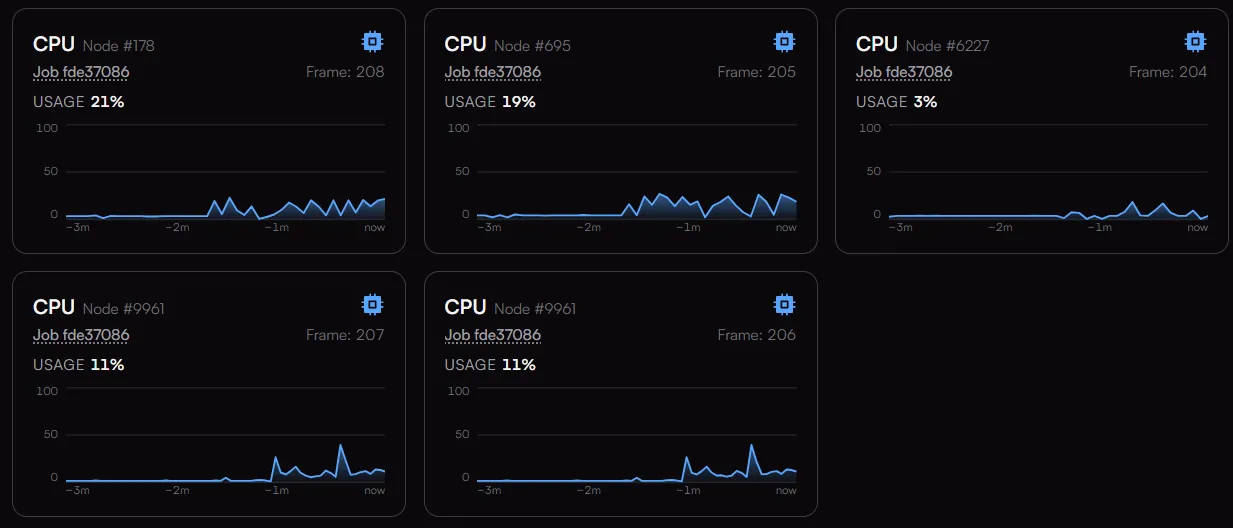
- CPU: Visualizes host processing utilization curves.
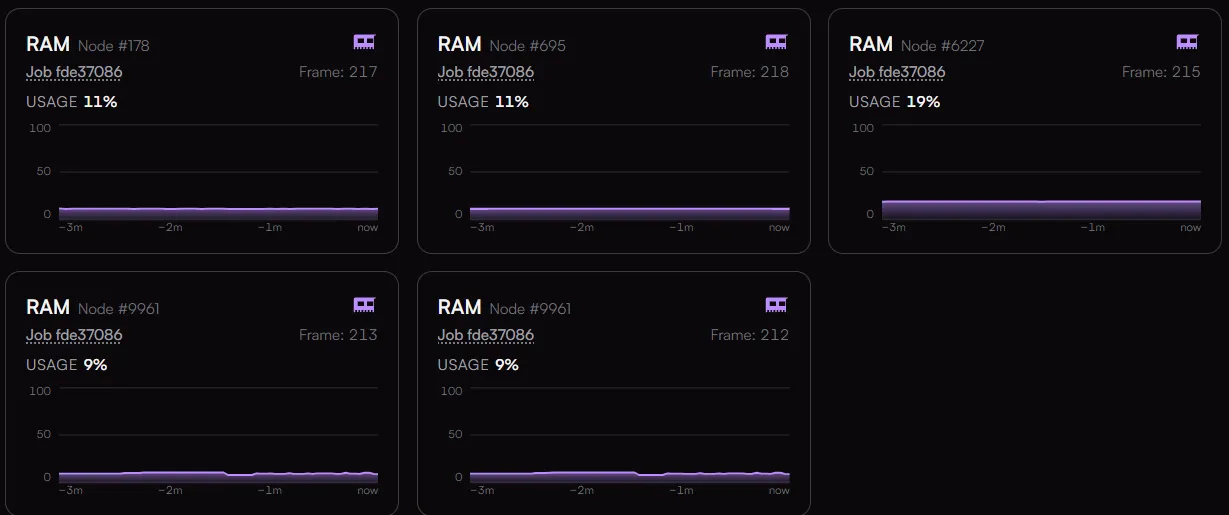
- RAM: Highlights active cluster system memory usage profiles over time.
- GPU Fleet Index: Breaks down your current cluster slice hardware footprint by chip model distribution (e.g., 4x RTX 4090, 1x RTX 5090).
Dynamic Telemetry Grid Views
The primary workspace adapts dynamically based on your selected sidebar telemetry filter category, displaying active hosts as dedicated diagnostic cards.
Telemetry Initialization and Loading States
When a node is first provisioned or transitions between tasks, the card reflects its onboarding pipeline as shown below:
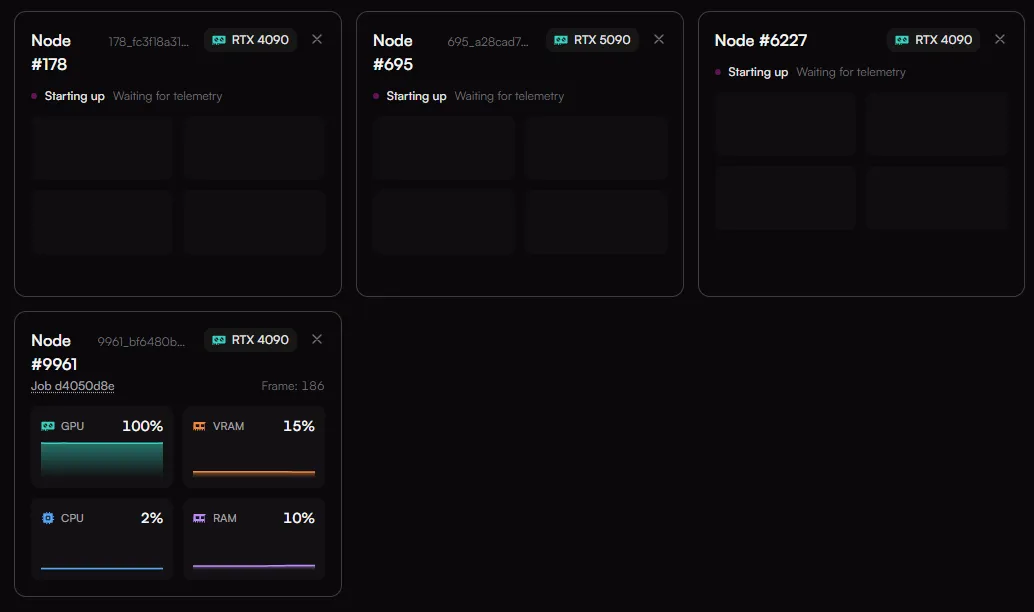
- Starting Up / Waiting for Telemetry: Indicates the remote host is initializing the secure compute container or syncing network dependencies before streaming analytical data.
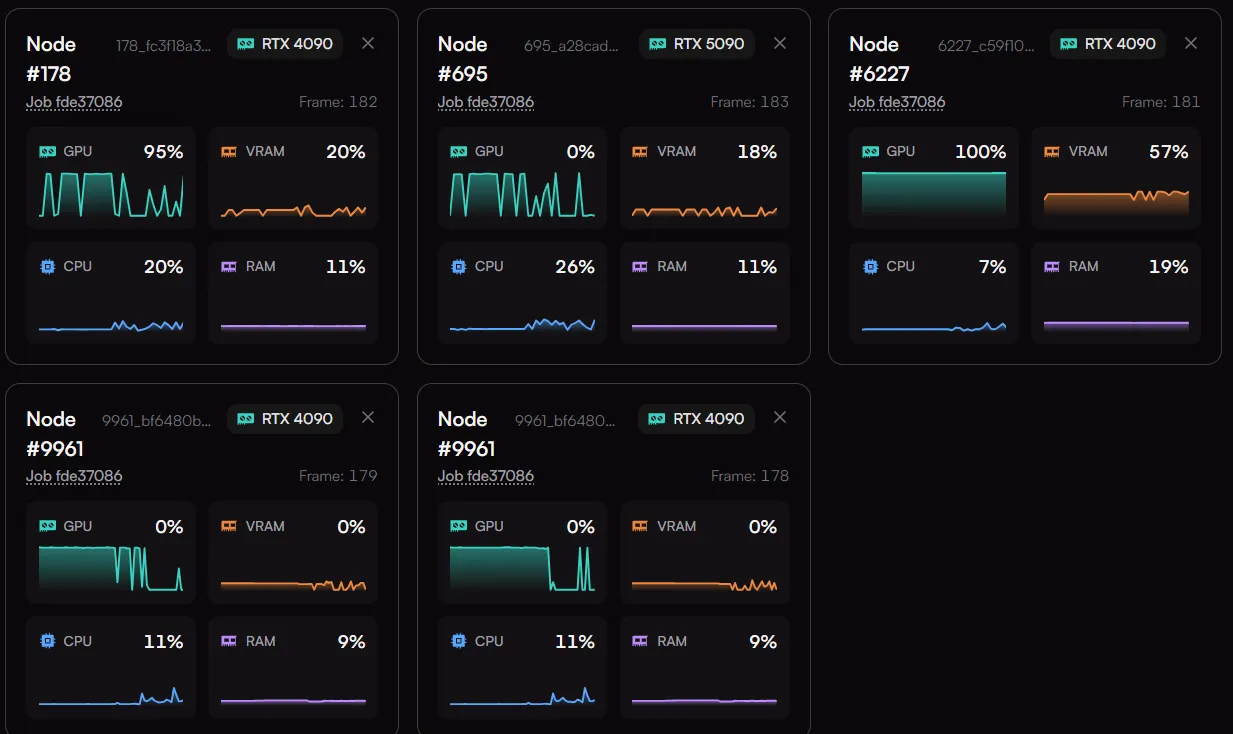
- Hardware Tags: Each header explicitly maps out the server's node number, unique infrastructure hash, and assigned GPU architecture variant (e.g., RTX 4090 or RTX 5090).
Consolidated Dashboard Layout
When navigating via the All Nodes default view, each node provides an aggregated, four-quadrant mini-chart board:
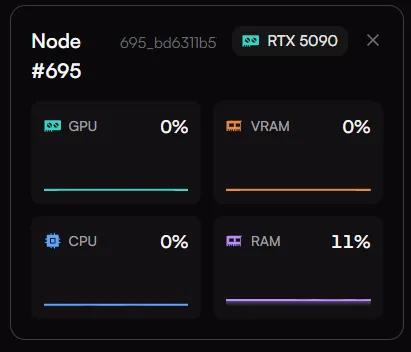
- Task Assignment & Matrix Tracking: Displays the active job hash (e.g., Job bd6311b5) along with a real-time progress register tracking the current frame sequence number being processed.
- Four-Point Metrics: Integrates layout graphs for GPU core load, dedicated VRAM usage, CPU multi-thread capacity, and system host RAM allocation percentages.
Terminating Nodes and Managing Sessions
The platform allows for granular control over your cluster slice, enabling you to instantly spin down individual worker nodes if your processing requirements change mid-job or a specific node is experiencing issues.
Node Disconnection
Each active node card features a termination option directly within its header:
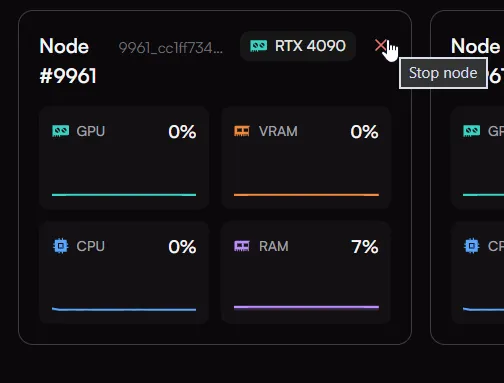
- The "Stop Node" Action: Hovering over the ✕ icon in the upper-right corner of any active card reveals a "Stop node" tooltip.
- Decentralized Redundancy: Clicking the close button triggers a safety confirmation modal to prevent accidental data loss. The prompt clarifies exactly how the termination impacts your project pipeline (e.g., "Stop node #9961? The job keeps rendering on the other nodes.").
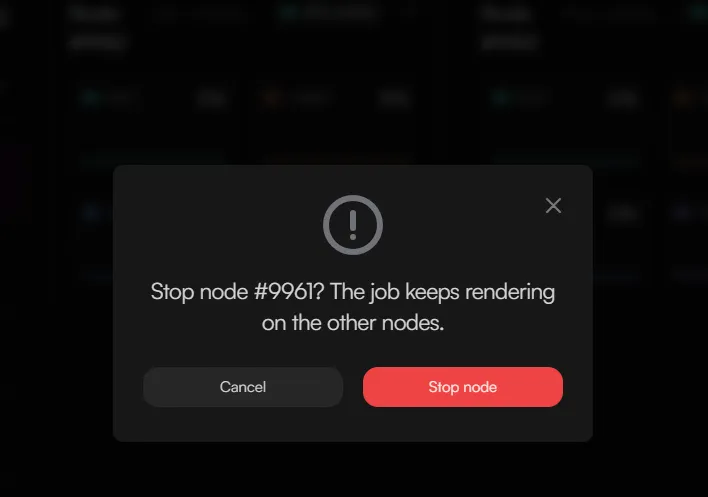
- Execution:
- Clicking Cancel returns you to the active telemetry grid.
- Clicking the red Stop node action button immediately kills the secure container lease on that specific machine, updates your live Nodes (GPU) count, and stops the financial burn rate for that hardware instance. The remaining nodes in your cluster will seamlessly continue processing any distributed rendering frames.